In a perfect world, the process of developing your organization’s Annual Report is a satisfying task of reviewing progress toward your goals, deciding on photos and profiles to include, and thanking your donors. The director writes a heartfelt letter, and you go to press!
But if your organization is starting (or restarting or reworking) your Annual Reports and the process to create them, it can be a stressful and daunting challenge. A lot happened in the past year, and you likely have many people to thank and many events to report on. What are the “best” statistics to include, and which are the most compelling stories to share?
Remember that just because it’s an “Annual” Report, you don’t need to include everything that happened in the past year. It is possible to create a great Annual Report without going crazy. Here are a few tips to consider for developing an Annual Report that your organization can be proud of, and that your stakeholders will actually read.
1. Keep it simple
There are so many good reasons to keep an Annual Report simple! It’s easier to focus your energy on getting fewer things covered — but covered with excellence — than to cover everything that occurred in the past year. Trying to report on too much will cause stress for the writers and artists who work on your report. Your stakeholders are more likely to read a short report carefully, and remember what they read.
2. Mix up your elements
Readability is a major goal for an effective Annual Report. Break up the elements you include to keep readers’ interest. Photos with one or two people featured are great. It’s highly recommended that the photos be of your own constituents, staff, events, or programs as much as possible. This personalizes the Report, and helps tell the story of how you are making a difference, in addition to sharing facts.
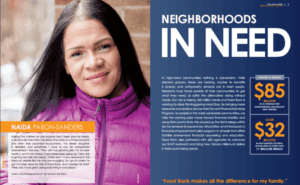
For example, in the Annual Report of the Food Bank of New York City, personal client profiles are interspersed with factual reports and statistics.
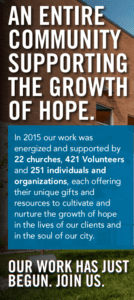
3. Evoke emotion
People make giving decisions based on emotion. It’s human nature. Even the most fact-driven donors respond well to a combination of facts and stories, especially when the two forms of communication reinforce each other.
In this page from LifeMoves in San Mateo County California, we see an example of this – an informative, quantitative pie chart right above a very personal story that relates to the message in the pie chart.
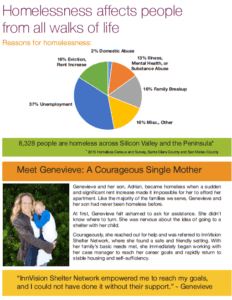
The data should justify the point you’re making with the story. The combination of quantitative and qualitative storytelling is very powerful.
4. Everyone loves infographics!
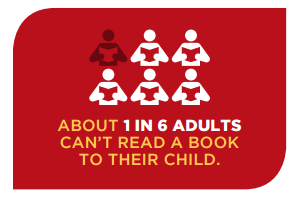
An infographic is quantitative data in a visually evocative format. At their best, a great infographic does double duty. It serves to present data and to offer analysis or interpretation. Here’s a good example from the nonprofit ProLiteracy, based in Syracuse, New York. They could have said, “Approximately 16.67% of American adults would qualify as functionally illiterate as of 2016.” But by choosing an infographic and an emotionally evocative description, ProLiteracy makes the same point in a much more relatable and memorable way.
Stanford SPARK was established in 2006 as a translational medicine program within the school of medicine at Stanford. Founded by Chemical and Systems Biology Professor
What Exactly is Accounting Subledger? Whenever you are bringing in funds to your organization, you must be able to reconcile those donations, gifts, pledges, and
5. Make it scalable
Scalable means thinking ahead about the many ways an Annual Report can be shared. For example, although the Annual Report by the Focused Ultrasound Foundation is only nine pages long, it includes multiple links out to other publications and resources for those who wish to read more.

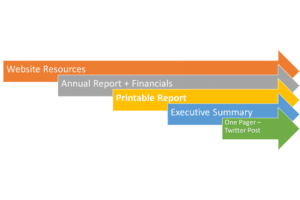
Keep the printable Annual Report in mind as the center of a spectrum of “Annual Report” related resources. The Annual Report broadens out to include more detailed financial reports, and may – as with the Focused Ultrasound Foundation – link out to more publications on the organization’s website.
On the other side of the spectrum, you might also want a two- or three-page Executive Summary, a one-pager, and even a scripted twitter post. These scaled down resources can help make the most of your Annual Report efforts to a wider audience.
6. Think replicable
Doing a massive, detailed, graphic rich (expensive) Annual Report your first year will be impressive. But… consider replicating the effort each year. Annual Reports, once you start them, are typically written every year. After the first year, it can be easier to create the next one, if you keep a few things in mind as you write the first.
- Point to your mission statement, your values, theory of change, and your stated goals.
- Create metrics that relate to your theory of change and goals, especially those where you can demonstrate positive change over time.
- Use your data. Look at the reports that your managers and executives use regularly. Can you report on those insights? What other performance data are you already tracking, and can it be used in the report?
- If your organization needs help organizing your data and drawing insights from it, contact a trusted partner like Cloud for Good to help you.
7. Proof-read
Your Annual Report should be professional, polished, and proof-read. An Annual Report serves as a transparent accounting of what you’ve accomplished over the past year, but also as a marketing piece. A great Annual Report can attract new donors, renewed donations from your base, and non-monetary support. Double check that each page or two-page spread stands up well on its own (for readers who skim). Use a consistent color scheme and style. And absolutely, double check the names and titles of donors if you thank them in your report.
8. What’s next?
Include a call to action! Even though the main purpose of your Annual Report is celebrating and communicating accomplishments plus saying thank you to donors, remember that your great Annual Report is also useful as marketing collateral. It’s completely appropriate to include positive descriptions of the various types of support you need. Though your report may be largely reflective of past events, you can also take the time to look ahead to your goals and dreams for what’s next, as the CityLink Center in Cincinnati did with their report.
You may also be interested in reading:
- Salesforce Fundraising Report 2017
- Salesforce Analytics 101: Organizing Your Reports and Dashboards
- The Connected Nonprofit